
As mentioned in last week’s blog post on television advertising during the COVID-19 quarantine, there are currently huge shifts occurring in video viewership in response to the COVID-19 pandemic. However, how much of a change is there, and does this change only include local news? Today, we focus on the statistical changes that have been taking place in media viewership due to the pandemic and share some interesting statistics that have been gathered in the past weeks by Comscore.
Live Television
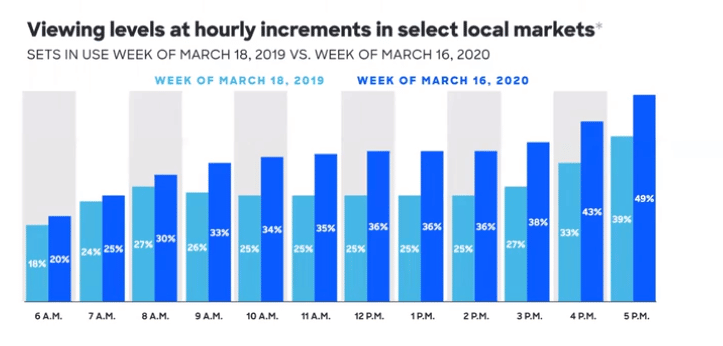
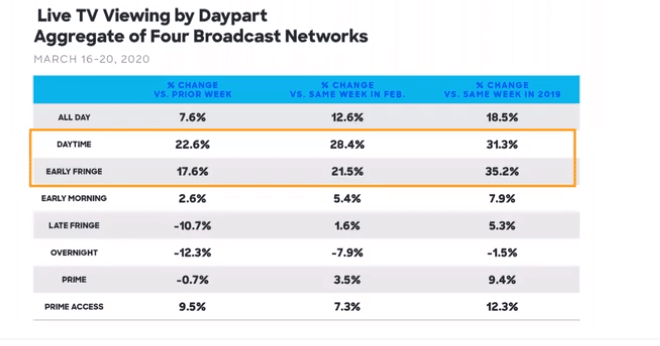
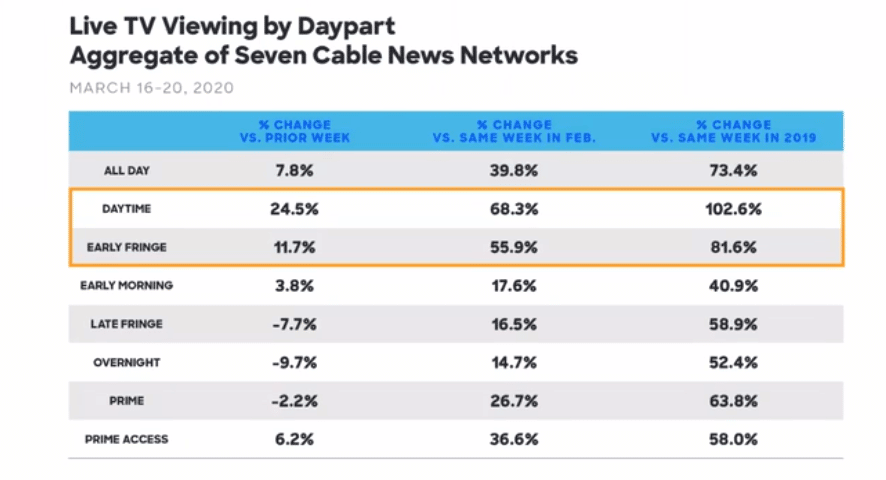
American households have viewed over 18 million hours of special programming related to COVID-19. Live television viewership is up in all dayparts year over year, and most significantly in the early fringe daypart of 3p-5p. Early morning news television viewership (7a-8a) is up 25% compared to last year, and viewing levels are continuing to expand as the day progresses. The statistics are showing that there are more viewers earlier in the day and that these viewers are continuing to engage with television throughout the day. Overall, on the four broadcast networks, Comscore is seeing a 31% increase year over year in daytime viewing and 35% increase in early fringe.
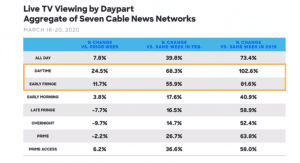
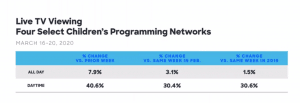
 Viewership in Cable news viewership is also up year over year, rising 73% for all day viewing, almost 103% for daytime and 81% for early fringe. Daytime viewing of children’s programming is up 31% during daytime.
 Streaming Television

Similarly, to live television, streaming television is seeing sharp increases is viewership as well. Year over year, Connected TV is up 29%. Connected TV has seen a 34% increase in hours watched while streaming sticks and boxes have seen a 20% increase in hours watched. Netflix, however, continues to be the top OTT provider, followed by YouTube, Hulu, and Amazon Prime. Other consoles that have seen increases in usage include gaming consoles (48%) and smart speakers (44%).


Other Media Mediums
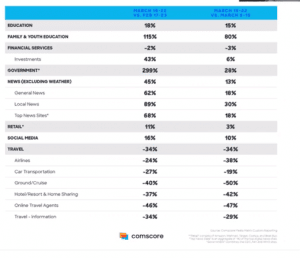
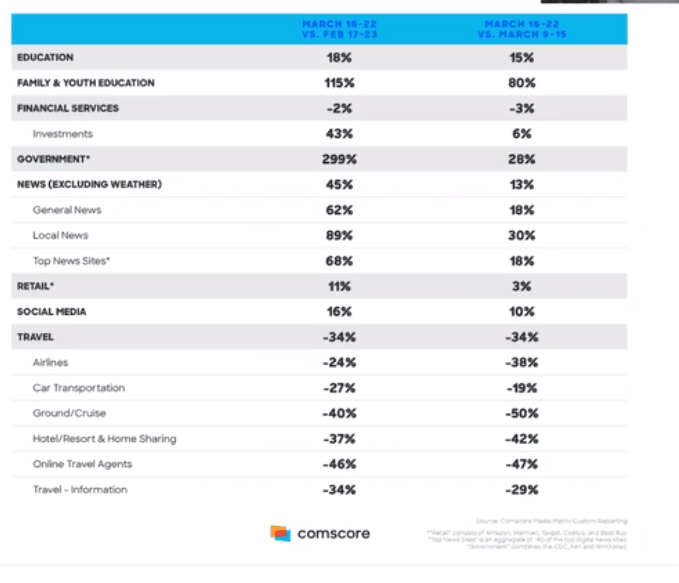
In one month, visits to local news websites traffic went up 89%. The week of March 16th saw 630 million visits to new websites, which was up 18% over the prior week.

There has also been a large change in web traffic around key industries over the prior month. During the examined week of March 16, when many schools were closed and online learning was starting, there were 518 million digital visits, an 18% increase to education-content websites. While the financial services category saw a 2% decline in searches, the investment category experienced a 43% growth.
Social media saw nearly 12 billion visits in one week after the beginning of the COVID-19 pandemic. This is by far the highest numbers of visits in a week this year. Retail sites also increased in traffic by 11% as home quarantining and shelter-in-place initiatives forced consumers to shop online.
 What Do These Statistical Changes Mean?
The statistical changes provided above are meant to demonstrate the vastly different ways that consumers are interacting with media because of the COVID-19 pandemic. Understanding how consumers are interacting with media is extremely important to businesses who are looking to market to those consumers. If you need a full-service media partner, Media Venue can help. We have the experience, resources and creativity to optimize the return on your marketing investment. Whether it is developing a traditional media planning and buying strategy or creating a digital marketing plan for your web presence, our media solutions deliver successful results.
Established in 1995 in Louisville Kentucky. Media Venue has a national, regional, local and direct client base. We also work with in-house marketing departments as well advertising firms of all sizes for media planning and buying purposes. We apply our vast knowledge and years of experience to develop a media plan that will deliver success. Check our media planning & buying services today.
References
Sarault, Jeff. Understanding Media Consumption During the Coronavirus Pandemic. Comscore, 3 April 2020. Webinar.